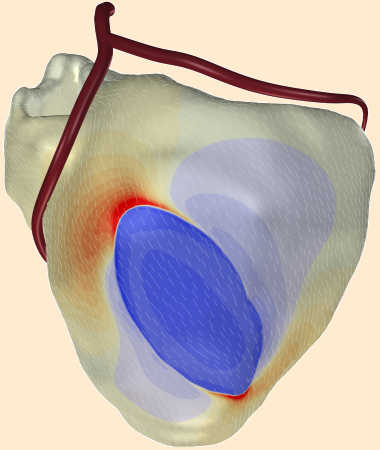
This figure shows extracellular potentials on the outside of the heart model, some time after activation was initiated (in the center of the blue area). Colors represent potential; yellow and red is positive, blue negative. Thin white line segments indicate the orientation of the muscle fibers on the outside of the heart. Fiber orientation rotates about 120 degrees across the wall. This causes the "rotating" asymmetry in the potentials.
To create this figure, propagating activation was simulated in a bidomain model of a whole human heart. Potentials were simulated at approximately 60 million points. The computation of the depicted extracellular potential at this scale demands a lot of computer power: a full heart beat takes 2 days to compute on 32 processors of a supercomputer.