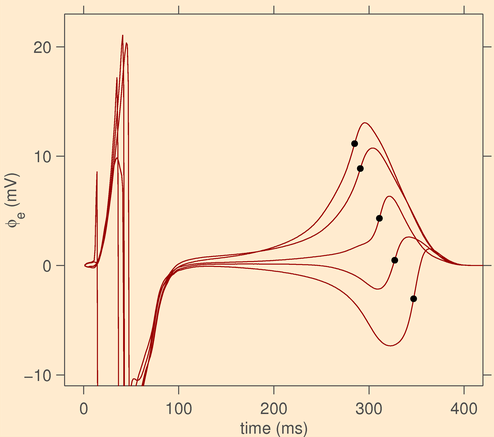
This figure shows simulated electrograms from various sites in the heart. Electrograms are electrical signals measured with electrodes in or directly on the heart muscle. Ideally, researchers would like to measure action potentials across the cell membrane, but this is too difficult in an entire heart. Electrograms are easier to measure, but are more difficult to interpret. Computer models are useful to show how electrograms relate to action potentials, because in the model, both are known at every point in the heart. In each of these electrograms, a black dot indicates the time when the underlying action potential repolarizes, i.e. makes its steepest downstroke. The figure serves to illustrate that this always coincides with the steepest upstroke of the electrogram, irrespective of the morphology of the so-called T wave.