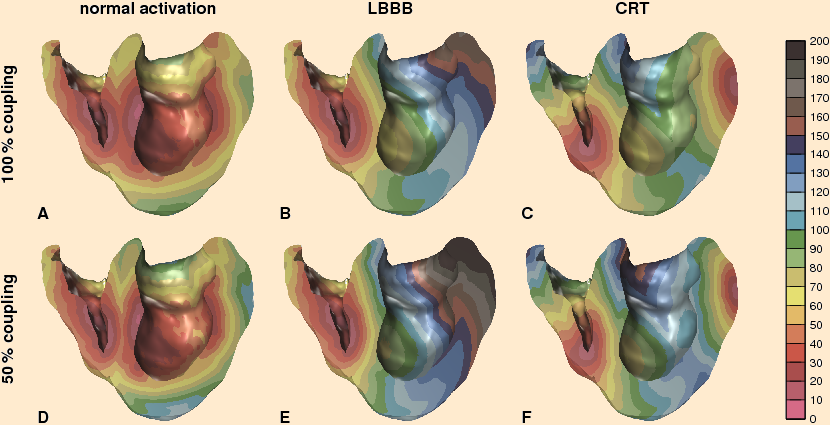
Simulation of the electrical activation sequence in the human ventricles for normal activation (A), Left Bundle Branch Block (B), Cardiac Resynchronization Therapy (C), 50% uncoupling (D), Left Bundle Branch Block with 50% uncoupling (E), and resynchronization therapy with 50% uncoupling (F). The color scale ranges from 0 to 200 ms with 10-ms intervals.