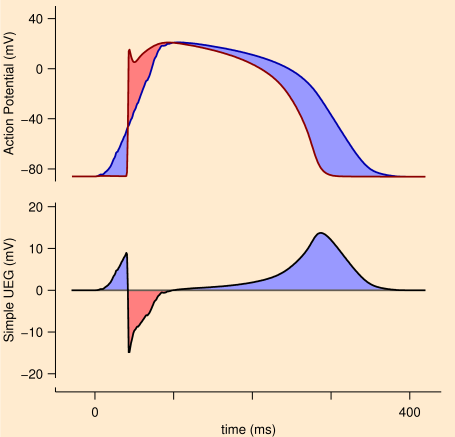
This is an illustration of a simple "rule-of-thumb" model for the unipolar electrogram. The upper panel shows an action potential (red line) and a special signal called the remote component (blue line). The remote component is an average of action potentials obtained from many sites in the heart, hence its appearance as a blurred action potential. When these two signals are subtracted from each other and scaled down by roughly a factor 4, a good approximation of the unipolar electrogram results (lower panel).