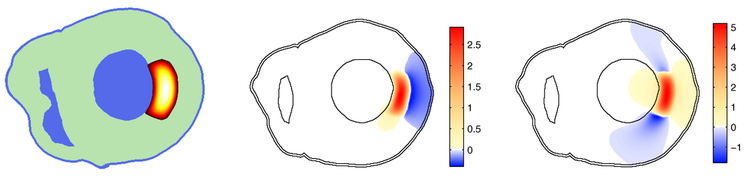
This figure illustrates simulated changes in extracellular potential (i.e. the potential that can be measured with an electrode plunged into the heart muscle) as a result of a subendocardial ischemic zone.
The leftmost panel shows a longitudinal section of the model anatomy, with normal myocardium shown as green and blood as blue. Black, red, yellow and white indicate increasing resting membrane potentials as a result of ischemia in a small subendocardial zone. The normal myocardium, although shown in a different color, has the same resting potential of -91 mV as the very border of the ischemic zone.
The middle panel shows extracellular potentials that would result from the changes in membrane potential, if the heart musle had isotropic conductivity. This corresponds to the prediction of now classical theoretical studies, which had to assume isotropy to make the calculations tractable. The potential during the ST-segment of the ECG is negative on the outside of the heart close to the ischemic zone.
In reality, the conductivity of the heart muscle is highly anisotropic. If this is accounted for - using a large-scale heart model running on a supercomputer - the changes in extracellular potential are rather as shown in the rightmost panel. The potential on the outside of the heart is now very small, and slightly positive.